Nine Demographic Traits that Differ by Age Group
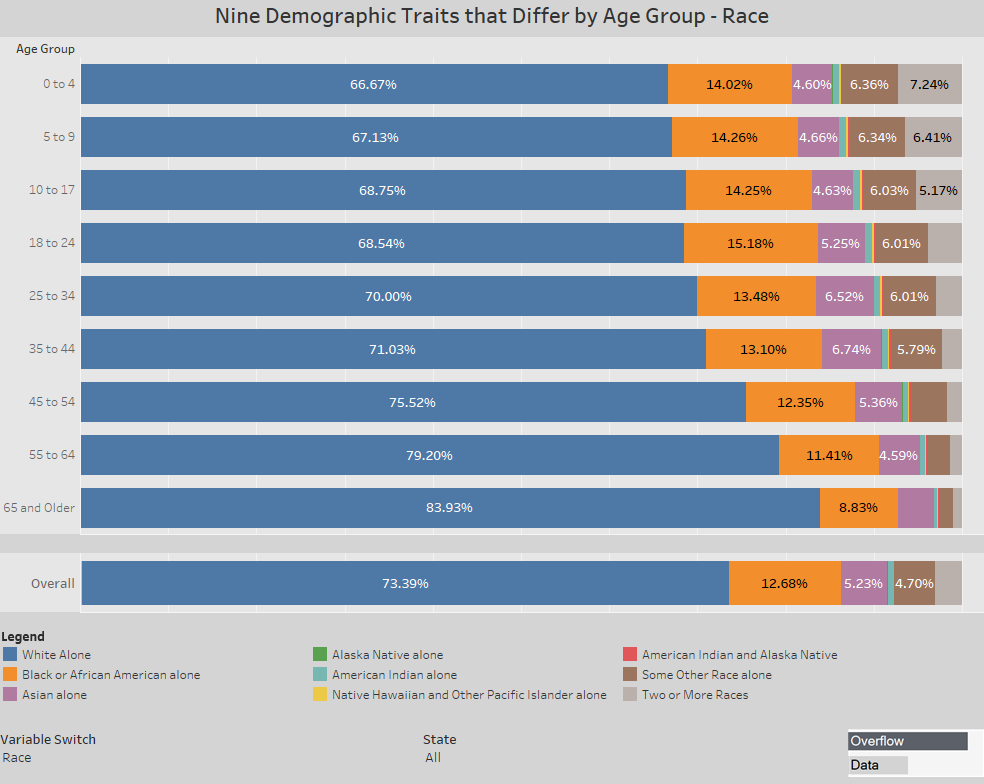
This visualization takes a look at census data to show how people in different age groups have vastly different demographic traits.
This visualization takes a look at census data to show how people in different age groups have vastly different demographic traits.
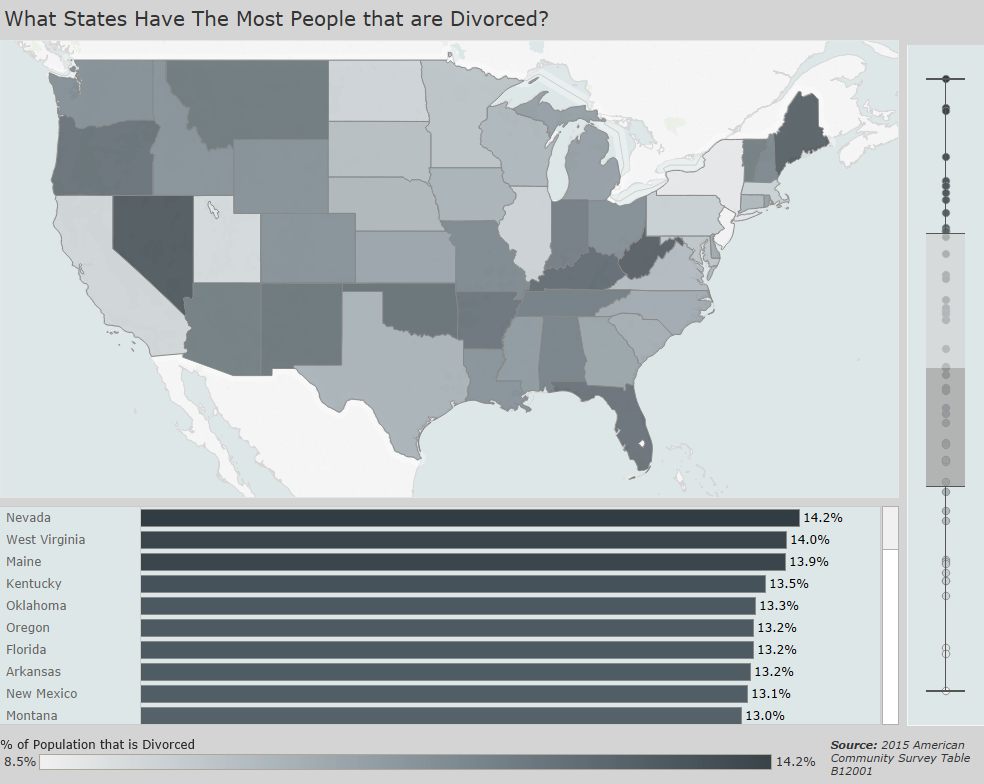
According to the Census Bureau, 11% of Americans are divorced. This visualization shows how this percentage differs by state.
According to the Census Bureau, 11% of Americans are married. This visualization shows how this percentage differs by state.
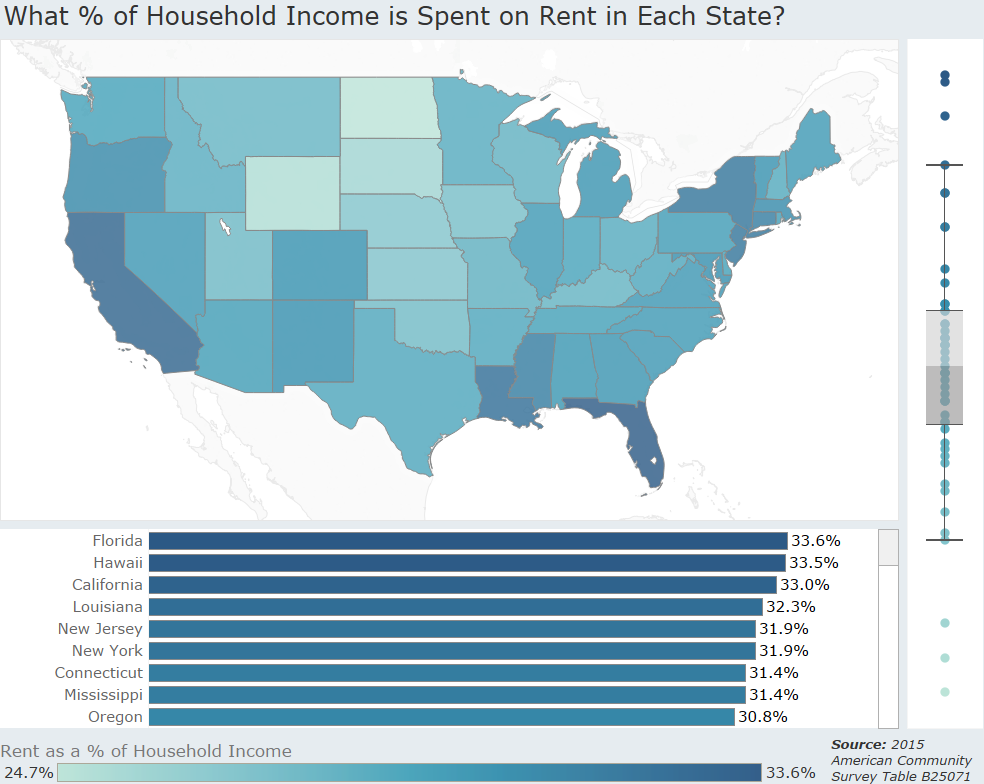
Renters in the US spend on average 30.3% of their household income on rent. Since this can differ by state we created this visualization to show the percentage by state.
Copyright © 2026 | WordPress Theme by MH Themes