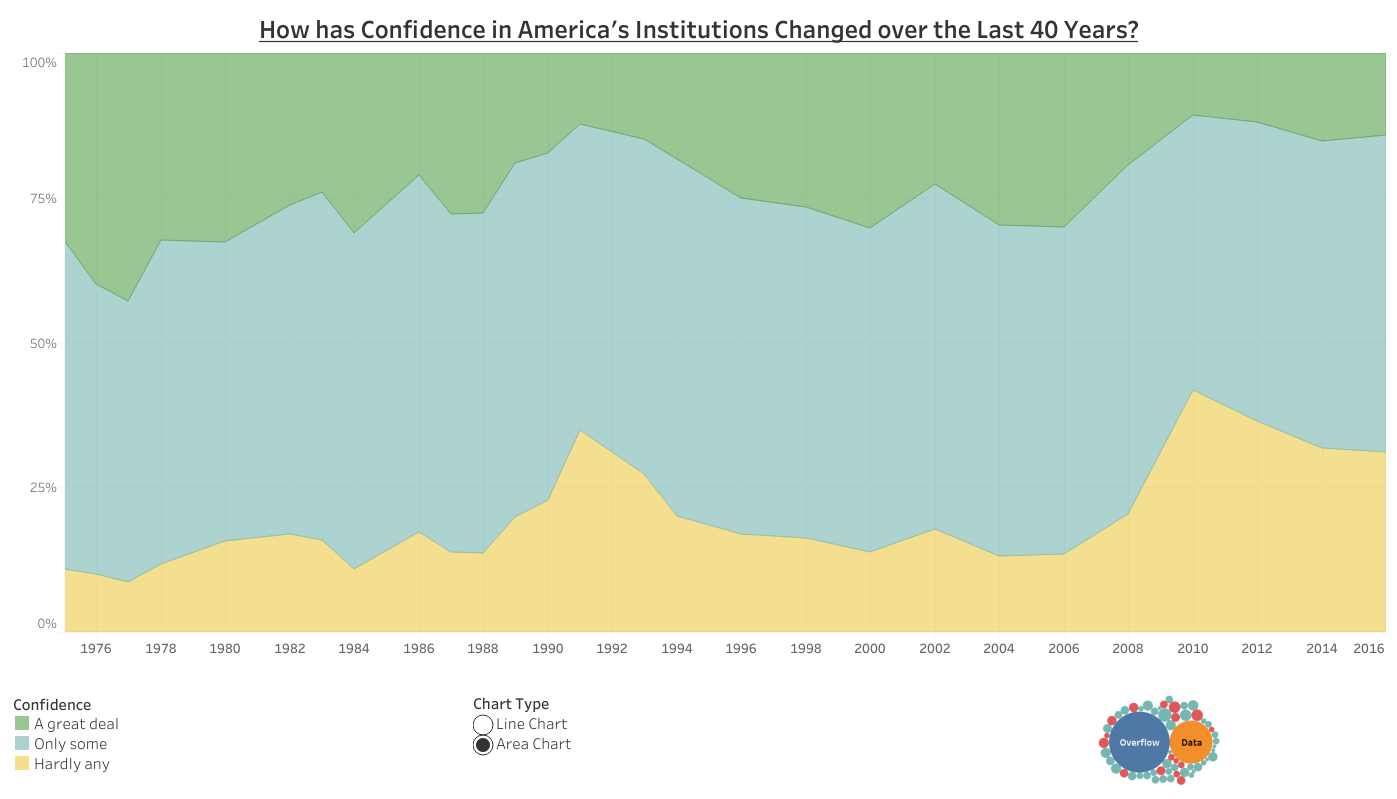
How has Confidence in America’s Institutions Changed over the Last 40 Years?
Trust in America’s institutions is changing. This visualization shows in what way.
Trust in America’s institutions is changing. This visualization shows in what way.
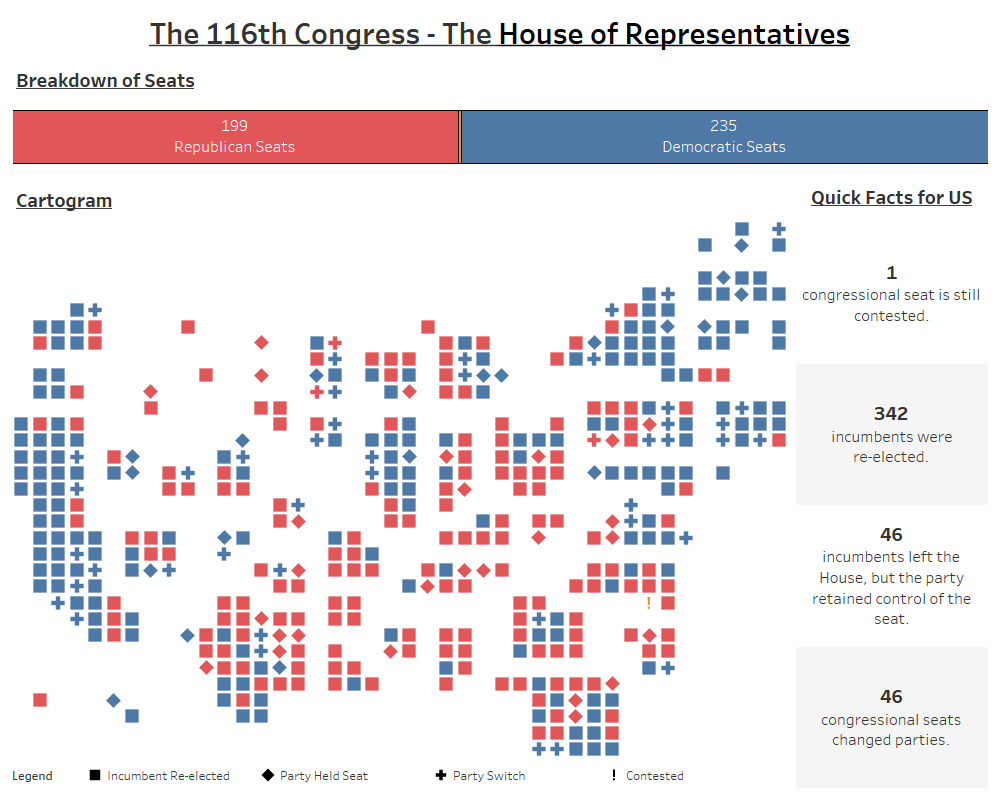
The 2018 midterms drastically changed the party breakdown of the House of Representatives. Use this visualization to discover the current state of the House.
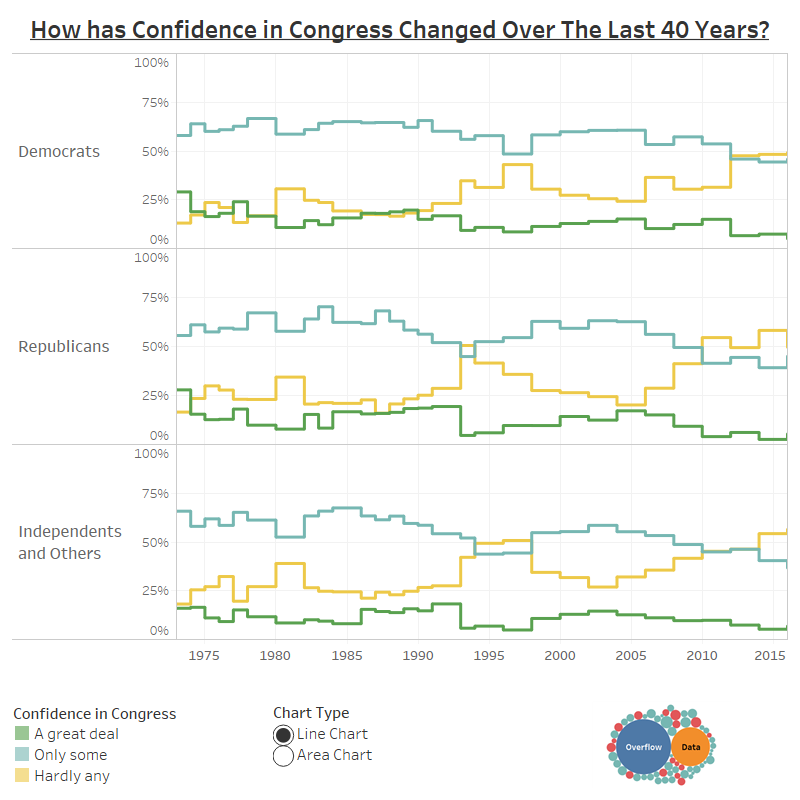
A look at how confidence in Congress has changed over time in the United States.
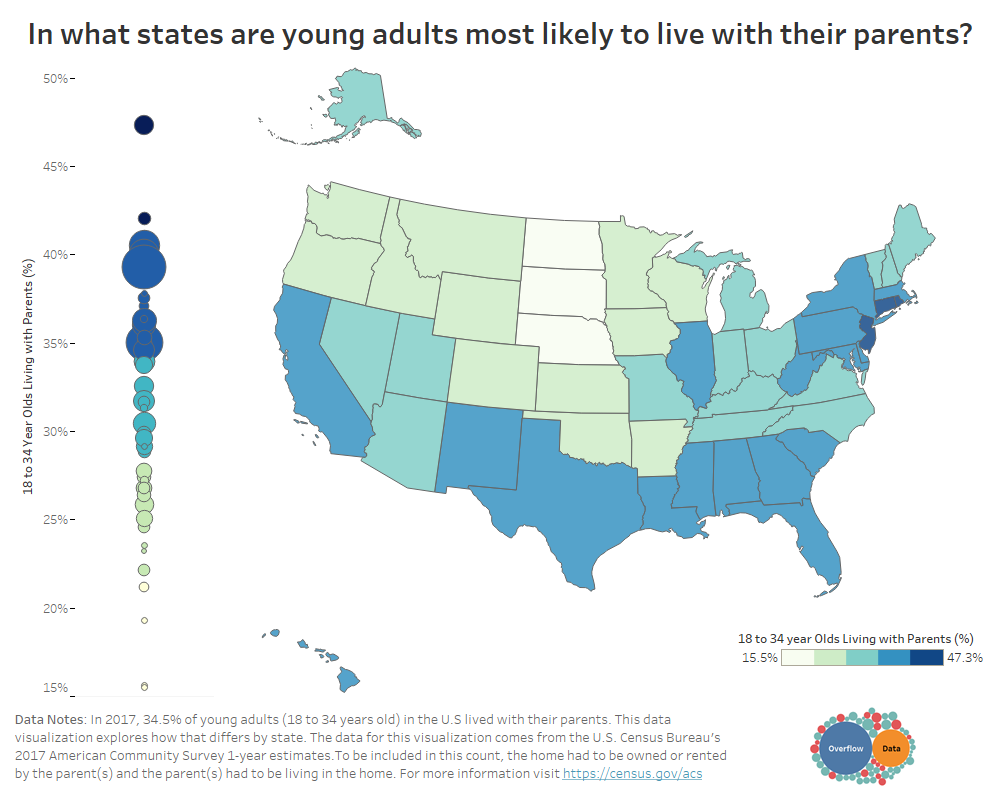
This visualization provides a look at how many young adults live with their parents in every state. Nationally, 34.5 percent of adults 18-34 years old live with a parent. This ranges from 47.3 percent in New Jersey and 15.6 percent in North Dakota.
Copyright © 2026 | WordPress Theme by MH Themes