This winter, we are pairing weather data and population data. This helps you understand to how many people are currently being impacted by winter weather. We are doing this with weather data from the National Weather Service and population data from the U.S. Census Bureau.
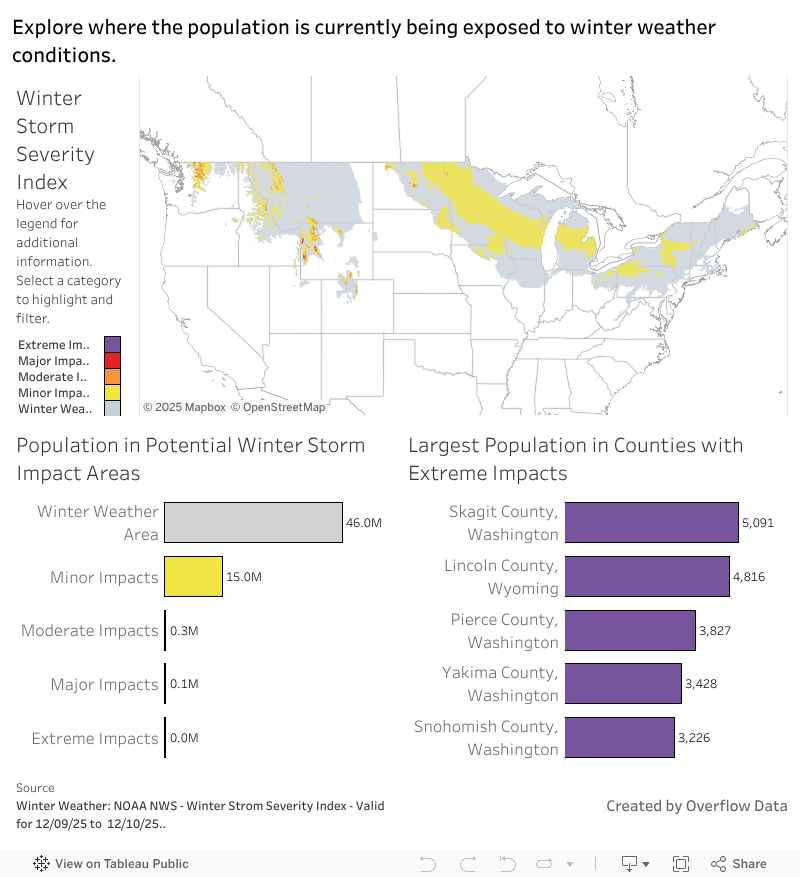
The Winter Storm Severity Index (WSSI) is a tool developed by the National Weather Service to help communicate the expected impacts of winter weather, not just the meteorological conditions. Instead of focusing solely on snowfall totals, the WSSI evaluates how a combination of factors,snow load, ice accumulation, blowing snow, road conditions, and cold temperatures, may affect communities. It classifies impacts on a five-level scale ranging from Minor to Extreme, providing a clearer picture of what residents, travelers, and emergency managers should actually expect. By integrating weather forecasts with local vulnerability considerations, the WSSI offers a more intuitive way to understand winter storm risks and prepare for potential disruptions to transportation, infrastructure, and daily life.
The population data comes from the U.S. Census Bureau’s 2023 Community Resilience Estimates.
The WSSI is joined to census tracts with a spatial join to determine the level of impact in each tract. This allows us to determine the population in each impact category. This is done with Python and the data is then visualized in Tableau.