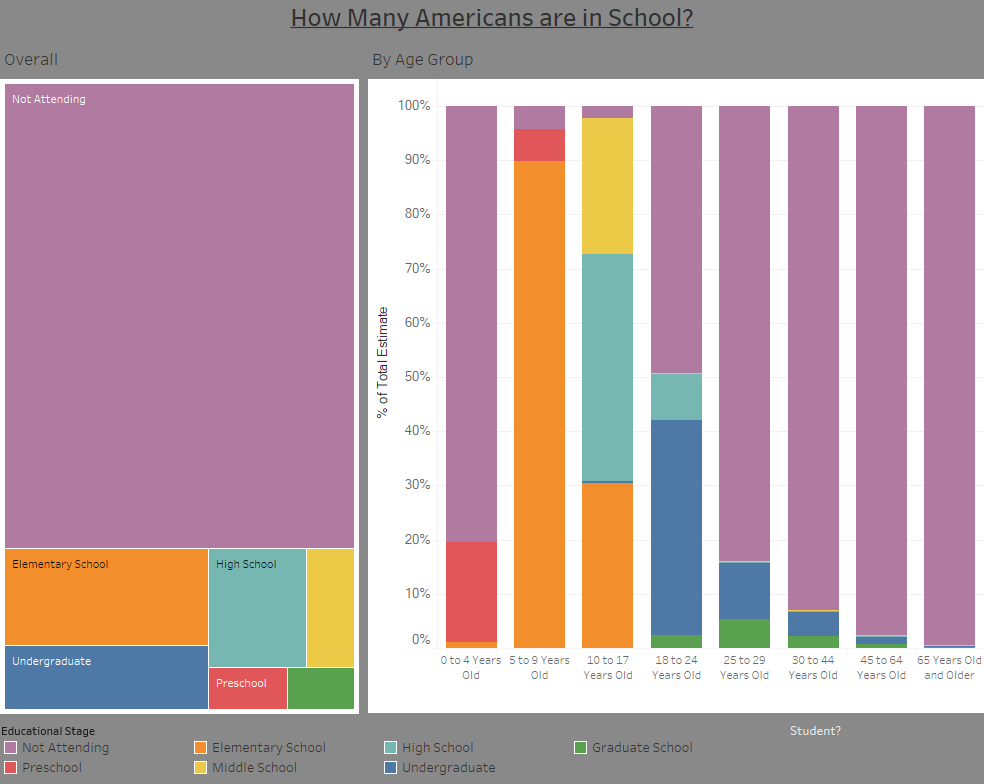
How Many Americans are in School?
A visualization exploring the educational enrollment of Americans.
A visualization exploring the educational enrollment of Americans.
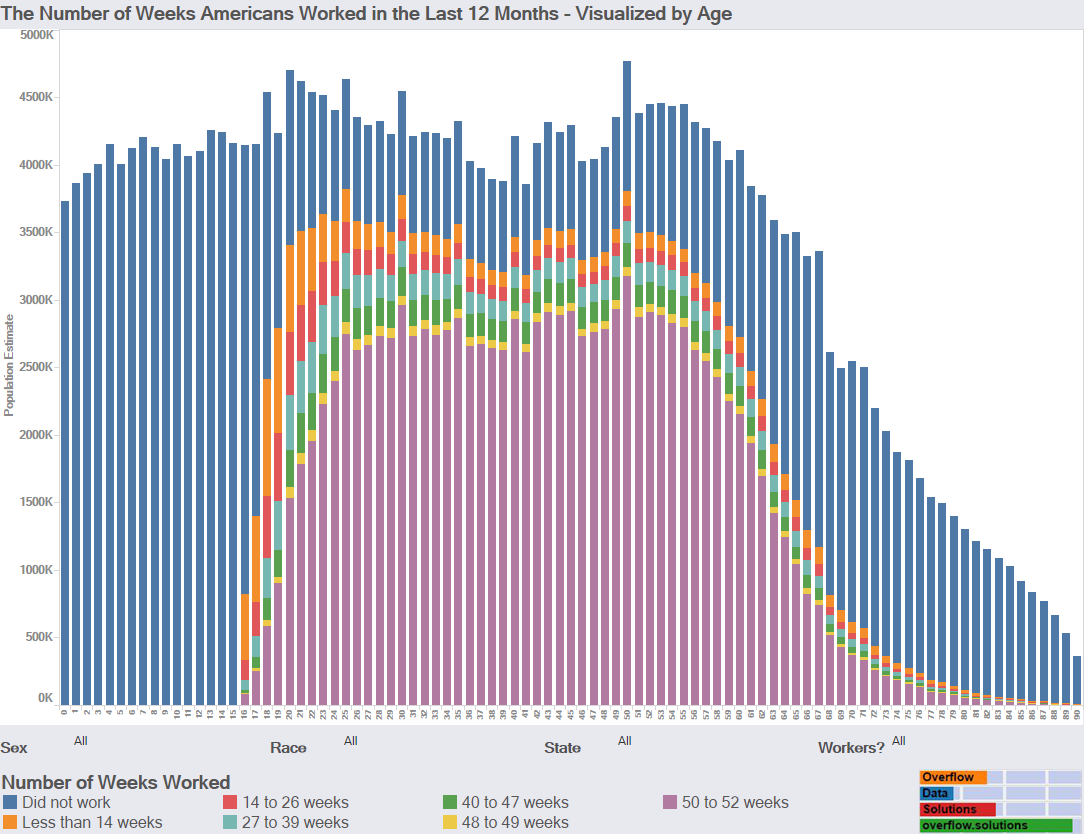
Introduction The American Community Survey estimates that 38.6% of people worked 50 to 52 weeks in the last 12 months ago. I decided I wanted […]
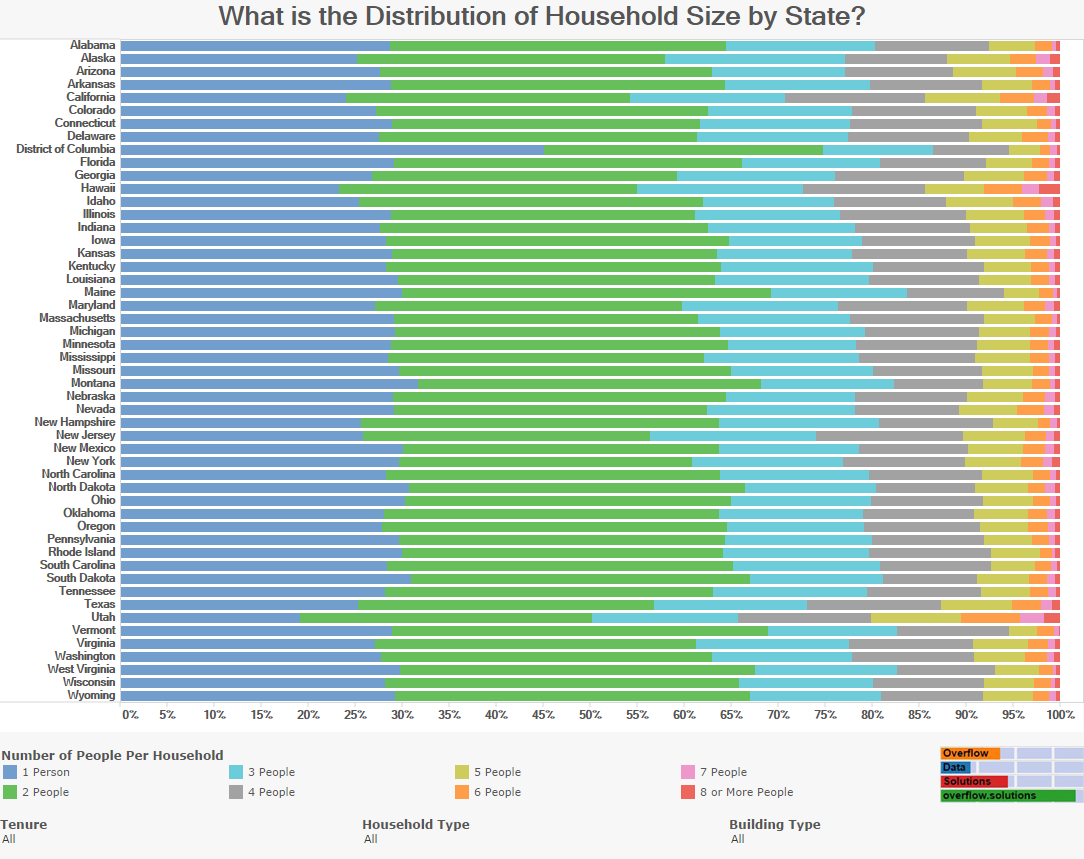
A look at the distribution of household size for every state.
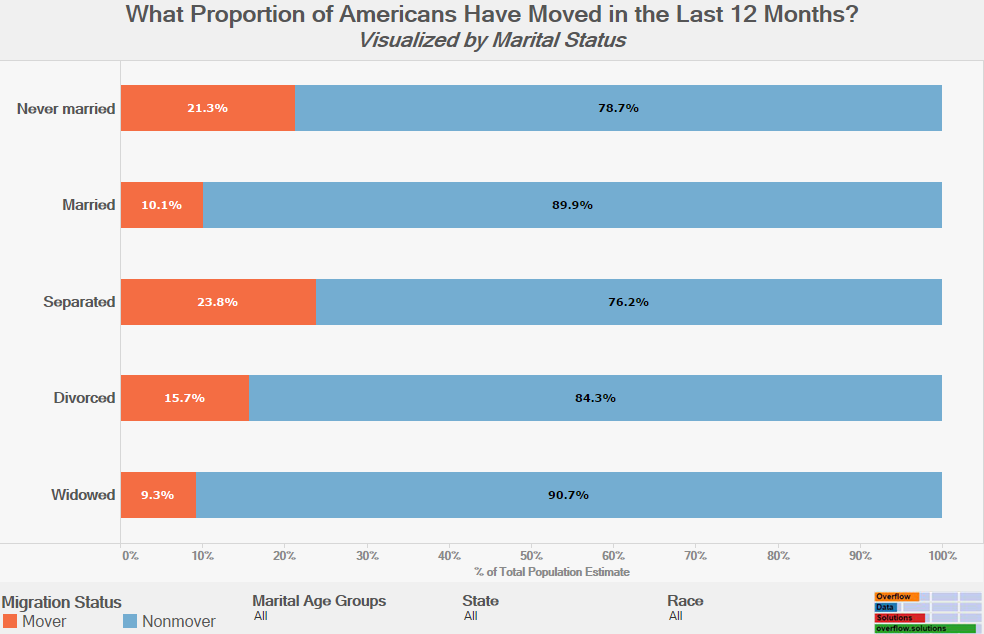
A quick look at if marital status plays a role in whether or not people are more likely to move.
Copyright © 2026 | WordPress Theme by MH Themes