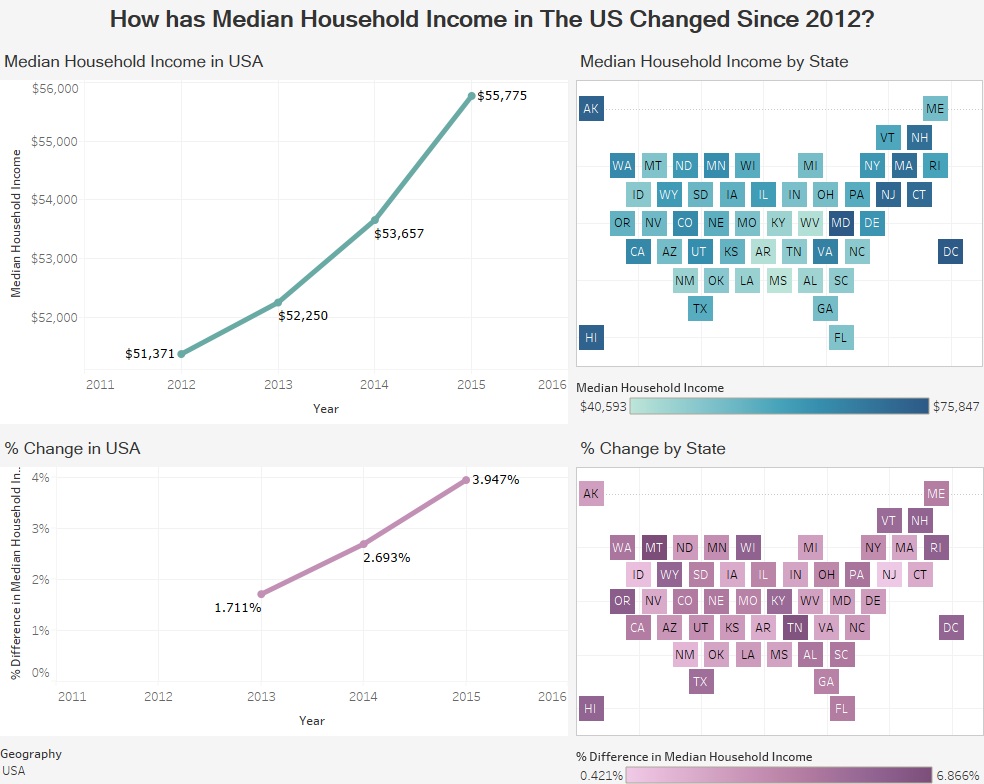
How has Median Household Income in The US Changed Since 2012?
A quick look at how income is changing by state in the US.
A quick look at how income is changing by state in the US.
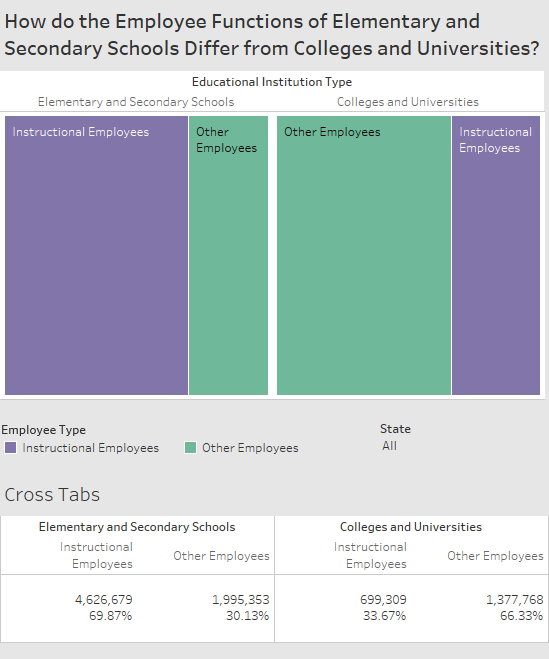
A look at how distribution of employees differs between elementary and secondary schools and institutions of higher education.
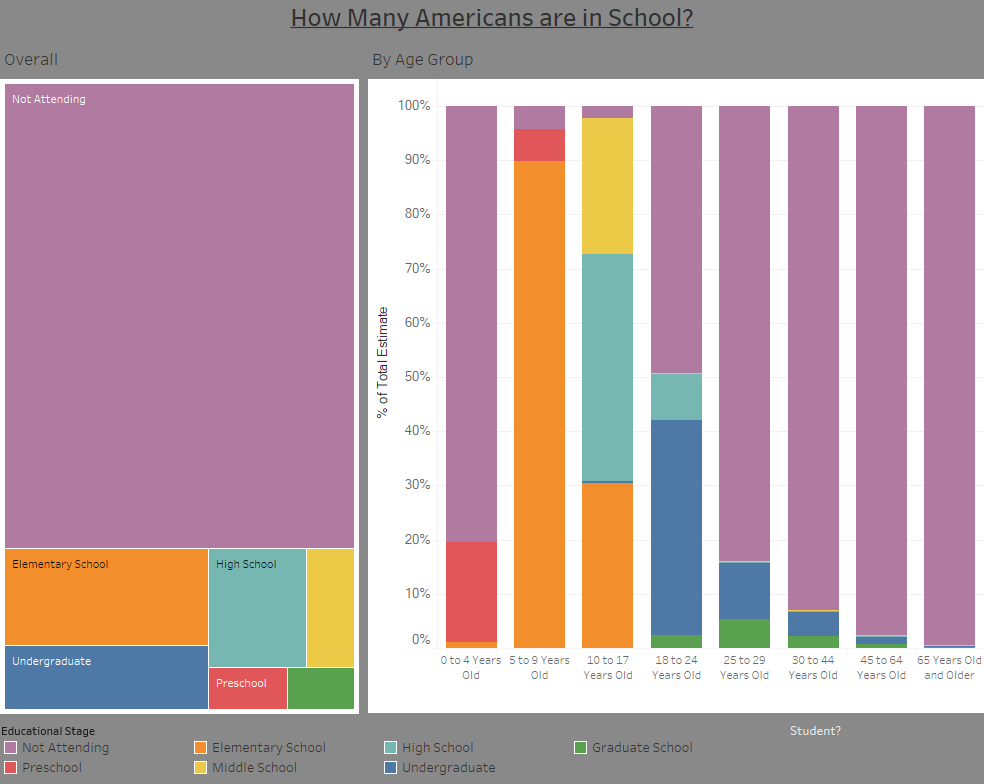
A visualization exploring the educational enrollment of Americans.
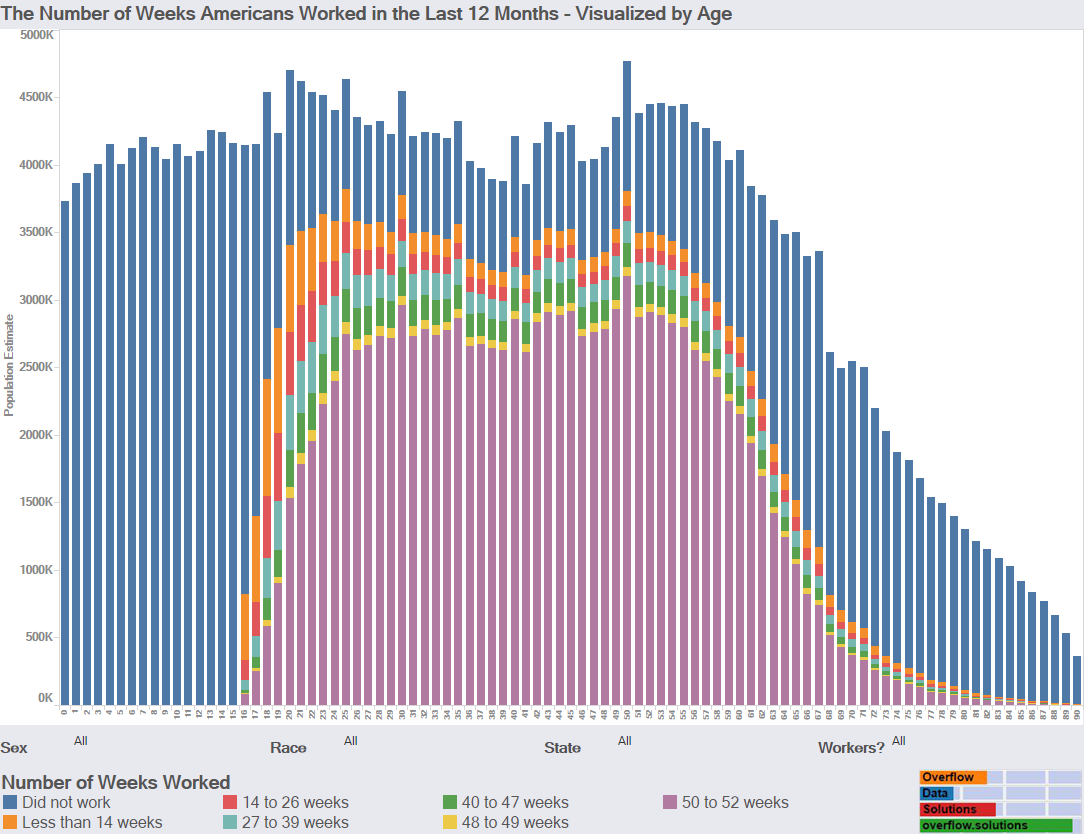
Introduction The American Community Survey estimates that 38.6% of people worked 50 to 52 weeks in the last 12 months ago. I decided I wanted […]
Copyright © 2026 | WordPress Theme by MH Themes